

This is a short video demonstration of the energy return of a carbon plate running shoe (one with a carbon plate in the midsole designed to increase energy return with each step and reduce fatigue) versus a regular running shoe. That…was a drastic difference. Almost as good as flubber, but

This is a 3D visualization created by Popular Science comparing the weights of Pokemon to real animals that weigh the same to give a better sense of their heft. Some more info to prove somebody actually spent time thinking about this: If Pokémon existed in the wild, which animals would
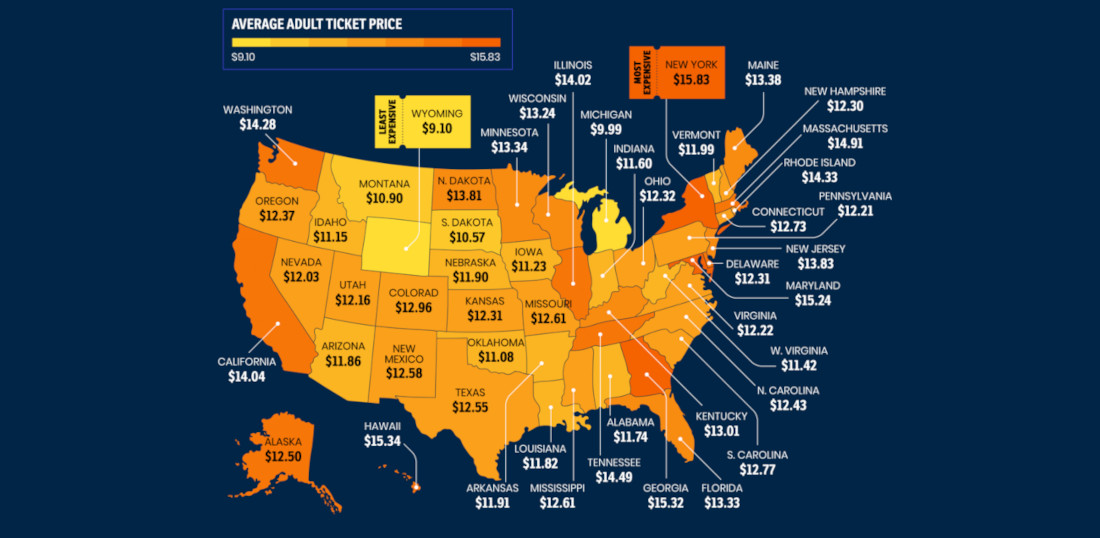
This is a map detailing the average cost of an adult movie ticket (that is, the price for an adult to see a movie, not the price of seeing an ADULT movie, those vary widely but I have paid as low as 25¢) in each US state. So, if cheap

This is a supercut created by video editor Thomas H. Smith of Disney Princess voice actors singing songs alongside the corresponding footage from the movies. It was a delight to watch. Watching my roommate eat his leftovers from last night for breakfast this morning? That made me sick to my
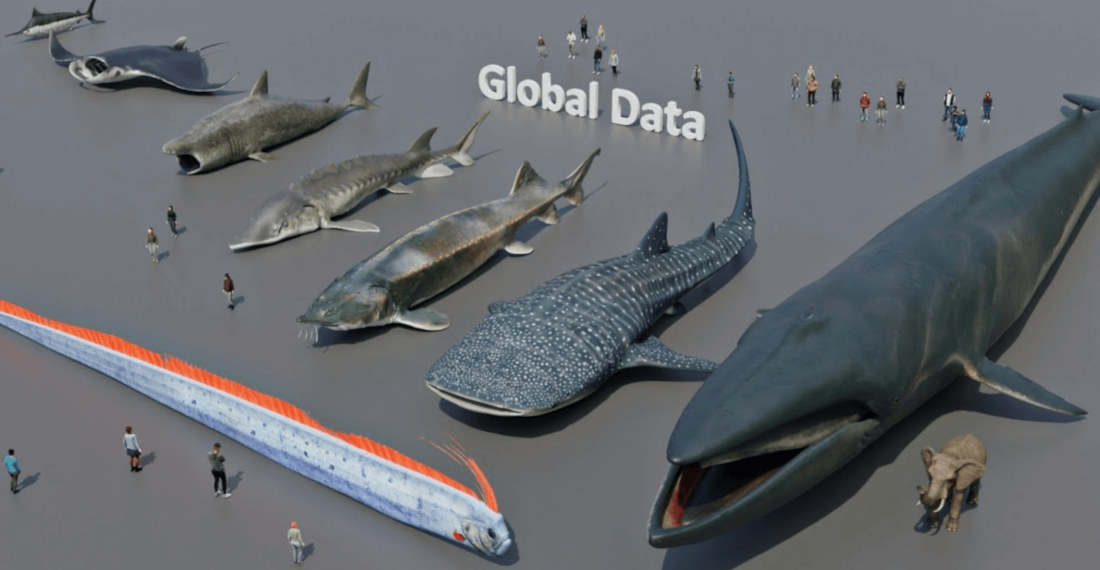
This is a visual comparison of increasingly larger fish, from the diminutive 1cm Paedocypris progenetica to the 30m blue whale. The video begins using a grasshopper for scale before moving to a bunny, and finally, humans. There are some big fish out there! Me? I’m neither the smallest nor the

To celebrate Valentine’s Day the only way I know how (with an underwhelming blog post), this is a map of the U.S. detailing each state’s favorite rom-com movie according to Google Trends data (see below for a much better breakdown). What’s your state’s favorite? I was more than a little

This is another size comparison video from MetaBallStudios (previously), this time comparing the size of various mechas as viewed by a person standing at ground level. It was actually pretty awesome to watch since the mechas strutted around running into things and weren’t just standing still. Was I disappointed Krang’s
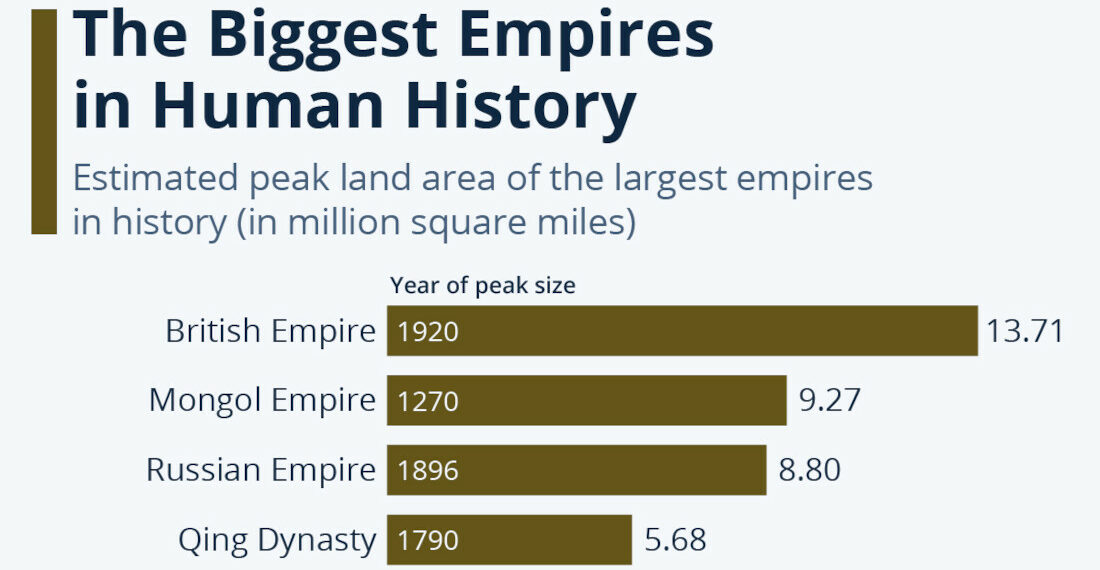
Sure, you probably think about the Roman Empire all the time, but how does it stack up against the largest empires in the history of mankind, ranked by total land area in million square miles? SPOILER: Not very well at all, it didn’t even make the top 8! Pfft, some


- April 11, 2024

- April 11, 2024